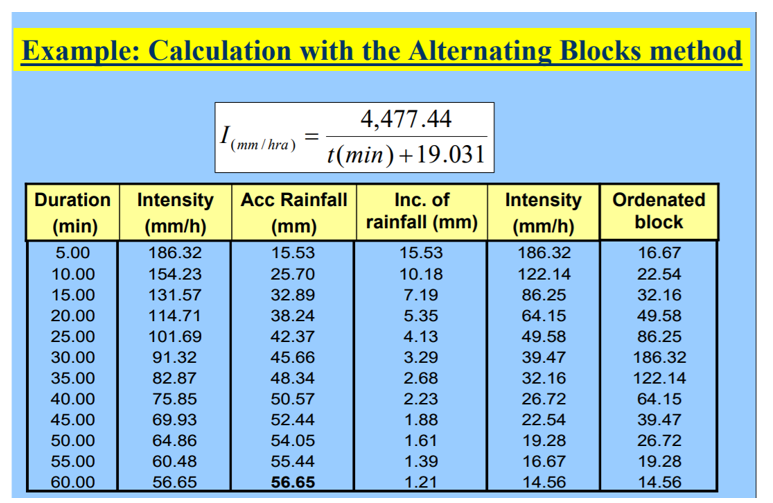
Chicago Storm Data
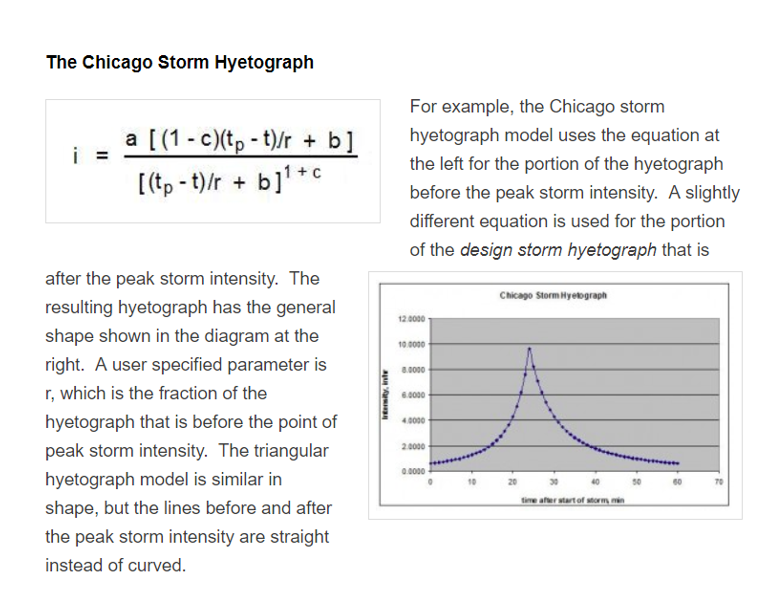
This method (Keifer and Chu, 1957) allows for determining a synthetic hyetograph starting from the empirical relationship of the IDF curves. Let us consider the general form of Talbot IDF formula:

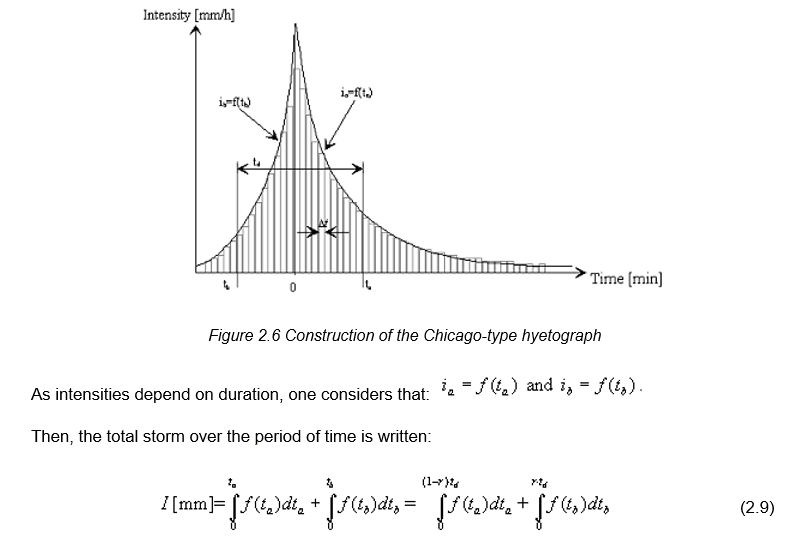


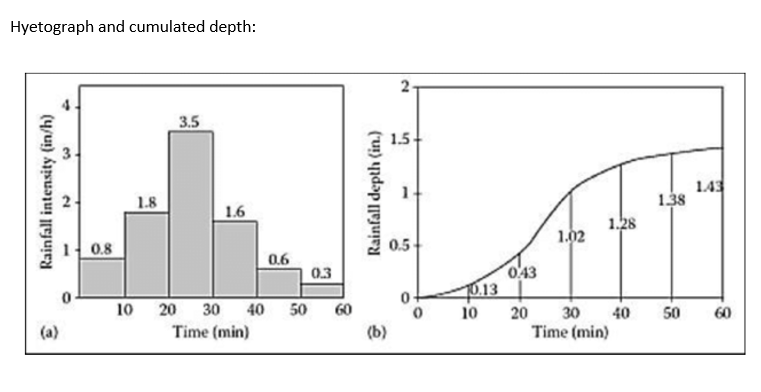
According to Debordes (1974) the coefficient r is evenly distributed across the interval (0, 1) so that the most probable value is found near the value of 0.5. As far as the influence of the location of the storm peak, Debordes and Raous (1976) have shown that the highest peak discharge under assumption of the same volume of the storm is obtained for delayed peaks, i.e. for 0.5 < r < 1. This fact is obvious, as infiltration is higher in the case of placing the peak of storm in the first half of the rainfall duration (0 < r < 0.5), as shown in Figure 2.7. Serban and Balut (1975) have analysed many storm events in Romania and they ascertained that there are two types of intense rainfalls: one having a positive asymmetry with cold and occluded fronts and another one with negative asymmetry with warm or secondary fronts. The second type of distribution belongs to weaker amounts of rainfall than the first type of storms that originate from cold and occluded fronts. The ratio between total volume and the volume of rain that falls until the peak intensity is recorded is presented in the Figure 2.8.