Calculation/Simulation: Graphical Results
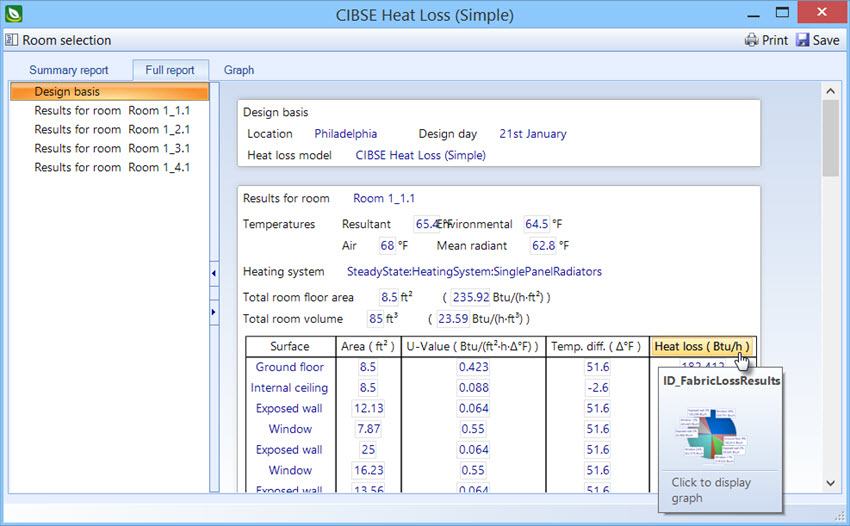
Data resulting from simulations and steady state calculations can be quickly viewed in a separate graph dialog while browsing the simulations/calculation results tables. Table headings on tables that display monthly or hourly data are linked to graph views. Clicking them opens a graph dialog.
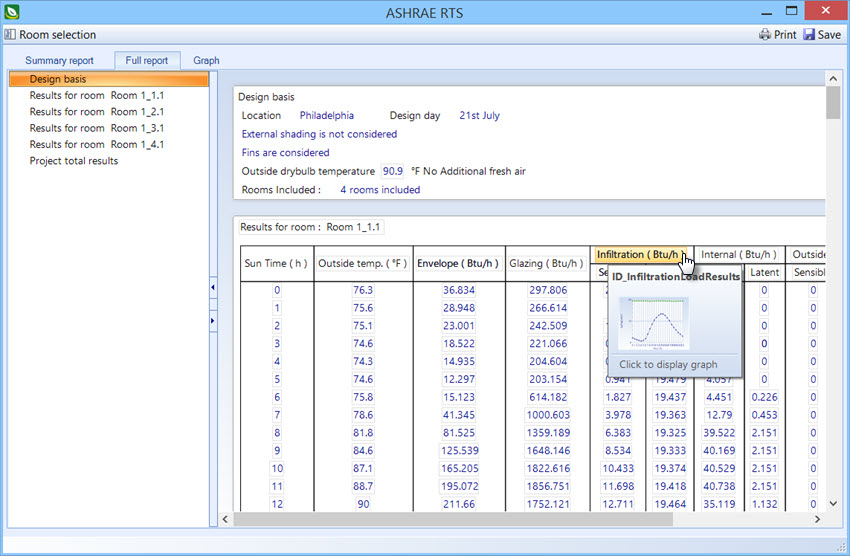
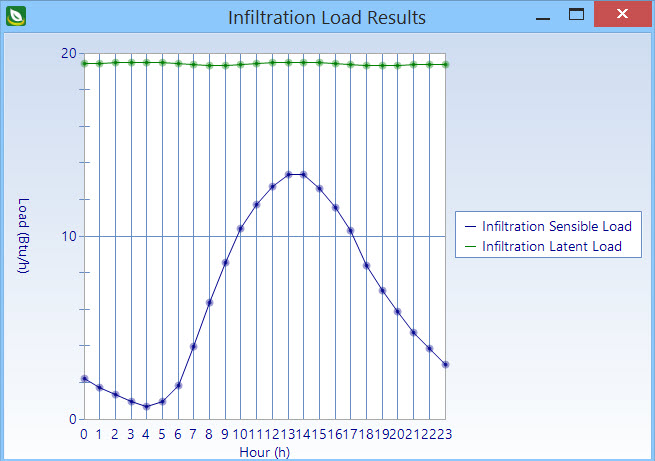
The Infiltration Load Results dialog is opened by the link. The Infiltration heading on the table spans both the Sensible and Latent columns. The data from both columns is graphed.
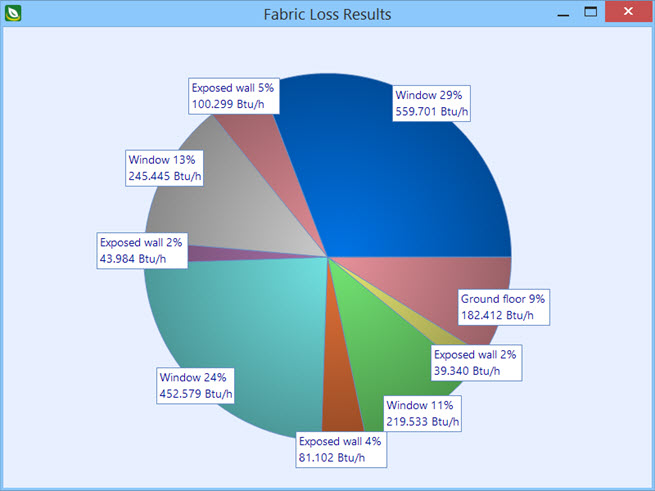
Similarly, table headings on tables that display room data are also linked to pie chart views. Clicking them opens a pie chart dialog.